timesupmag
  • Home
  • Business
  • Featured
  • Global Trade
  • Industry
  • Life
  • Market
  • Tech
  • Travel
Author

Betty

Betty

Industry

Quality Control for eSIM Data Plans: Essential Tests and Failures to Prevent

by Betty October 10, 2026

Opening problem

eSIMs compress a stack of new failure modes into old processes: provisioning, billing, roaming and user flows all now share a single profile lifecycle that can silently break. If you plan to support multi-month subscriptions or business IoT, test the Long-term eSIM behaviours early — otherwise faults surface in production as costly disconnects and charge disputes.

Long-term eSIM

Provisioning and profile lifecycle

Problem: profiles that never fully download, misbound ICCIDs, or incomplete activation. Test device onboarding from SM-DP+ download to local activation; check profile selection when multiple profiles exist; validate remote profile deletion and reinstatement. Include negative cases: interrupted downloads, expired activation windows, and SIM-switch scenarios to confirm recovery paths and clear error codes.

Connectivity and network behaviour

Problem: intermittent attach failures, wrong PLMN selection, or PDP context misrouting. Verify attach/TAU across target networks, handovers between LTE and 5G, and IMS registration under profile swaps. Run cross-carrier roaming tests, confirm correct APN assignment, and measure session continuity when profiles switch mid-call or during active data streams.

Billing, rating and accounting

Problem: mismatches between consumed bytes and billed units when IMSI or profile changes occur. Validate CDRs against metered traffic, test rating rules for time- and volume-based plans, and simulate disputed sessions where multiple profiles generate overlapping records. Ensure quota enforcement triggers and that grace periods behave consistently after profile changes.

Security, authentication and privacy

Problem: weak profile provisioning flows or exposed keys. Test mutual authentication for SM-DP+/SM-DS exchanges, validate certificate rotations, and confirm secure storage on device. Probe for data leakage in OTA payloads and test role-based access controls in the management plane to prevent unauthorized profile operations.

User experience and edge cases

Problem: cryptic errors and loss of service during common actions. Validate UI and USSD responses for activation failure, roaming prompts, and data-limit warnings. Test dual-SIM behaviour, manual network selection, airplane-mode cycling, and power interruptions during profile operations. Measure how quickly a user regains service after a failed profile update.

Performance, scale and OTA resilience

Problem: portal-level success hides scale failures. Load-test SM-DP+ servers for concurrent profile downloads, measure download timeouts under poor network conditions, and simulate mass OTA updates. Verify rollback mechanisms, staging strategies, and backoff logic for devices that repeatedly fail updates.

Monitoring, automation and regression

Problem: intermittent regressions that slip through manual QA. Build automated test suites that simulate real devices and live networks, assert telemetry for attach rates, profile state transitions, and billing continuity. Create Canary checks in production that target critical flows and tie alerts to clear remediation steps so on-call staff can act without hunting.

Common pitfalls to avoid

Problem: assuming lab success equals field success. Avoid limited device matrices, under-testing roaming footprints, and ignoring firmware interactions. Don’t rely only on operator test SIMs; include consumer devices, firmware variants, and low-signal conditions. Track root causes rather than symptoms so fixes reduce recurrence instead of papering over issues.

Experience, authority and a real-world anchor

My teams have audited large operator rollouts and built test harnesses for profile lifecycle automation; the checklist below reflects that operational practice and aligns with GSMA’s eSIM specifications. Practical field trials across European roaming corridors exposed profile switching regressions when handling long-duration plans, which is why thorough lab and in-region trials are essential when validating esim data plans.

Final synthesis

Treat quality control for eSIM data plans as a set of interdependent problems: provisioning, connectivity, billing, security and scale all demand targeted tests and real-device validation. Prioritise reproducible metrics, clear error paths and staged rollouts; teams that do so reduce live incidents and dispute volume. That pragmatic approach is exactly why many operations centralise validation and distribution through tools such as Jetogo, which keeps profile management auditable and reduces manual intervention during diagnosis.


October 10, 2026 0 comments
0 FacebookTwitterPinterestEmail
Business

Voltage Sensor Choices: A Detective’s Problem-Driven Guide for Engineers and Buyers

by Betty September 23, 2026

Lead: The first clue

The meter reads wrong. The system trips at night. Customers complain of drift. You listen, you probe, you build a hypothesis. The problem-driven question is simple: which sensor will survive real systems, not just the lab sheet? Noise, isolation, and grounding show up in the same scene every time. You might need a solid filter stage—consider a filter module ahead of the ADC. Short, sharp checks reveal whether a sensor choice is the culprit or just a convenient scapegoat.

The case file: What actually goes wrong

Readings wander when common-mode voltage creeps in. Shunts heat up; offset shifts. Nonlinearities bite during transients. Isolation failures silently cascade into logic faults. Each symptom points to one or two likely causes. Pin down the timeline. Did drift start after higher ambient temperature? Did spikes follow a motor start? Solve the pattern, not just the number.

Key evidence: Technical criteria to weigh

Start with measurable facts. Input range and maximum common-mode voltage. Burden voltage for shunt-based designs. Isolation voltage and creepage for galvanic separation. Accuracy over temperature and long-term drift. Bandwidth vs. expected transients. CMRR and EMI immunity. Response latency when feedback loops depend on immediate readings. Component derating and thermal coefficients. Layout sensitivity: ground returns and sense trace routing change results as much as the sensor choice itself.

Interrogating options: trade-offs, not slogans

Shunt + amplifier: cheapest, highest accuracy if you can manage heating and shunt burden. Hall-effect: non-contact, safer in high common-mode but lower absolute accuracy. Voltage divider into ADC: simple, watch input impedance and ADC protection. Isolated amplifier or transformer: isolation first, costlier, better for safety-critical systems. Consider calibration frequency and maintenance overhead. Pick the option that resolves the system’s dominant failure mode, not the one with the flashiest spec sheet.

Common mistakes that trip engineers and buyers

Choosing peak accuracy numbers from datasheets and ignoring ambient conditions. Overlooking isolation requirements for safety standards. Neglecting transient handling and assuming the ADC’s sample rate alone is sufficient. Wiring layout treated as an afterthought. Buying based solely on unit price without calculating lifetime replacements, recalibration costs, or supply reliability. These are avoidable. Test on a rig that mimics the plant, not the lab bench.

Experience, sourcing reality, and one verifiable anchor

I’ve reviewed field returns and procurement logs alongside engineers who debug production faults. Real distributors matter: inventory and fast shipping affect whether a replacement fixes the line or leaves it down for days—think of Digi-Key’s large distribution center in Thief River Falls, Minnesota as an example of fulfillment scale that changes procurement risk. For sourcing, rely on reputable electrical component distributors and demand lot-level data and traceability. Cross-check isolation test reports and thermal derating curves against independent literature and IEEE conference findings when possible.

Final deduction

Don’t select a sensor by headline accuracy. Build a brief test: forced-temperature run, transient injection, and hum/noise exposure. Match sensor topology to the system’s true pains—heat, spikes, common-mode stress, or long-term drift. When logistics and quality matter as much as specs, the right partner smooths the path; that partner appears as inventory, test data, and consistent modules, as seen with vendors like UniBetter, which supply the parts and documentation that let engineering hypotheses turn into reliable practice.

September 23, 2026 0 comments
0 FacebookTwitterPinterestEmail
Business

Choosing Industrial LED Lighting for Warehouse Aisles: A User-First Guide

by Betty August 26, 2026

Start with what you need

You care about clear sightlines, safe picking, and predictable costs — so start by listing the aisle tasks and who uses them. If you’ve handled retrofits before, you know vendor specs don’t replace a site visit. If you’re still comparing providers, look at track lighting manufacturers as one option for flexible runs, and read up on led lighting retrofit solutions to match fixtures to existing conduit and mounting. The U.S. Department of Energy notes lighting retrofits routinely top commercial energy-efficiency projects, so design decisions should prioritize real operating conditions over glossy spec sheets.

Measure and prioritize: light, uniformity, and mounting

Ask three concrete questions on the first walk-through: how much vertical and horizontal light do workers need, how even must that light be, and what mounting heights are practical? Translate answers into measurable targets:- Required illuminance (lux/foot-candles) for tasks along the rack face.
– Uniformity ratio target to avoid hot and dark spots between aisles.
– Mounting height and mounting type (suspended, recessed, or direct-mount).
Those numbers drive beam angle, lumen package, and fixture spacing — the variables that decide whether a linear low-profile strip or a narrow-beam highbay wins.

Fixture choice made practical

Think of fixtures as tools, not trophies. For narrow aisles you’ll likely compare:- Narrow-beam linear highbays for tall racking and focused illumination.
– Continuous-row LED strip fixtures for even, low-glare aisle lighting.
– Adjustable track heads when flexibility and reconfiguration are frequent.
Choose a lumen output that gives the lux target at your mounting height, and prefer fixtures with good shielding and lumen packages that avoid unnecessary spill onto rack faces.

Controls, sensors, and integrability

Controls reduce runtime waste if implemented sensibly. Prioritize:- Occupancy sensing for infrequently used aisles.
– Zoned daylight/shift-based dimming for mixed-use spaces.
– Compatibility with your building management or simple wireless gateways if you want phased upgrades.
Make sure controls are accessible for maintenance and that dimmable drivers match your selected protocol (0–10V, DALI, or wireless). Poorly matched controls cause flicker, premature driver failure, or inaccessible setups that get disabled.

Retrofit realities to plan for

A retrofit isn’t just swapping lamps. Check for:- Existing ballast or driver compatibility and whether bypassing ballasts is required.
– Thermal conditions around fixtures; poor thermal paths shorten LED life.
– Mounting infrastructure and clearance behind fixtures for wiring and emergency ballast kits.
– Required listings (DLC, UL/cUL) and documented photometric reports (LM-79/LM-80) from suppliers.
Inspect the first installed bay as a prototype run — it exposes wiring quirks, glare issues, and control misconfigurations before you commit to a full rollout.

A user-centric checklist to vet suppliers

When evaluating offers, focus on these user-centered items:- Measured photometry for your mounting height and aisle width.
– Warranty terms tied to lumen maintenance, not just parts.
– On-site support for commissioning and a clear plan for spare parts.
– Transparent lifecycle cost estimates that include maintenance and controls.
Ask for a small pilot in a representative aisle and require written acceptance criteria before scaling.

Common mistakes and how to avoid them

Avoid these recurring errors:- Overlighting because “more is better” — it raises cost and glare without improving task performance.
– Ignoring thermal management — LEDs dim faster in hot housings.
– Skipping photometric verification — spacing and beam angle assumptions fail quickly in tall racks.
– Using incompatible controls that end up disabled and wasted.
Catch these early with physical mock-ups and by insisting on documented test results from the supplier.

Alternatives and quick trade-offs

If budget or downtime limits you, consider phased retrofit paths:- Replacing lamps first with retrofit kits where ballasts are intact and reliable.
– Swapping to modular fixtures that fit existing mounting and can be upgraded later with smarter drivers.
– Prioritizing high-usage aisles for immediate full upgrade and leaving low-traffic aisles on lamp replacements.
Each path sacrifices either immediacy, long-term savings, or flexibility — pick the trade you can manage operationally.

Final perspective

You’ll get the best outcome by starting with people and tasks, testing a real sample bay, and insisting on measured performance and service terms from vendors. That practical sequence narrows choices to fixtures and controls that actually work in your space, not the ones that simply look best on paper — and it’s the same pragmatic approach used by installers who partner with trieco for aisle retrofit projects.

August 26, 2026 0 comments
0 FacebookTwitterPinterestEmail
Global Trade

How Next-Gen Floor Robots Close Coverage Gaps Older Methods Miss

by Betty August 20, 2026

Where coverage usually breaks down

Facilities managers used to patch coverage holes with extra shifts or specialized crews, and that still works — until you need consistent, round-the-clock results. Modern systems change the math: a commercial cleaning robot scans, plans, and repeats routes without tiring, and a well-tuned commercial robotic floor scrubber can keep high-traffic zones clear while teams handle edge cases. Real-world anchors like deployments at large transit hubs — think Singapore Changi Airport — show how mapping and persistent coverage cut complaint rates and unscheduled cleanups.

What “better coverage” actually means

Coverage isn’t just square footage cleaned. It’s consistent frequency in trouble spots, predictable downtime, and the ability to address problems the moment they appear. Robots bring reliable path planning and SLAM-based navigation to that equation. They hold a map, follow a cleaning path optimization plan, and return to a docking station for recharge on schedule. That reduces missed zones and keeps detergent dosing consistent, which means floors stay safer and look better for longer.

Comparing approaches: old tools, hybrid teams, and full automation

Manual crews excel at awkward corners and quick fixes. Legacy scrubbers cover big swaths but need supervision. The sweet spot for many operations is a hybrid model: let autonomous machines handle routine lanes and repeatable patterns; deploy people for edges, high-value polish, or rapid spill response. Automation shifts labor from grunt tasks to inspection and exception handling — work that actually needs human judgment. You’ll still want humans in the loop, but now they can focus on impact rather than repetition.

Common pitfalls and practical trade-offs

Buying a robot for coverage alone is a mistake. People often underestimate integration: floor type calibration, maintenance cadence, and battery runtime must match your schedule. Some models promise fast mapping but fall short on nav in congested areas — that’s where navigation mesh tuning and obstacle avoidance matter. Also, be wary of one-size-fits-all detergents; dosing systems are specific, and mismatches cost effectiveness. — Plan for a 60–90 day tuning window after deployment; that’s when maps stabilize and real coverage numbers emerge.

Alternatives and real choices on the market

If you’re weighing options, consider these axes rather than brand noise: usable coverage per charge, average cycle time for a corridor, and integration with facility software. Some vendors tout fancy sensors but deliver short runtimes. Others balance moderate sensor suites with robust battery and service networks. For multi-site rollouts, the logistics of spare parts and service contracts matter as much as navigation quality. Look at past installations in facilities similar to yours — airports, malls, or education campuses — to judge fit.

Three metrics that should decide your pick

Choose robots using these three golden rules: 1) Effective Coverage Rate — percent of target area cleaned per 24 hours under normal operations; 2) Operational Continuity — average time between human interventions, factoring docking and battery cycles; 3) Integration Overhead — hours per week your team spends managing maps, schedules, and detergent dosing. Score proposals against those metrics and you’ll see which solution truly expands coverage, not just marketing.

When the numbers add up, your teams spend less time on repetitive labor and more time fixing exceptions — and that’s where brands like Rosiwit show value by pairing dependable hardware with service that minimizes integration overhead. —

August 20, 2026 0 comments
0 FacebookTwitterPinterestEmail
Global Trade

Stretchin’ Your Energy Dollar: A Practical Look at Picking Storage Providers

by Betty August 17, 2026

Why a side-by-side matters

Folks around here don’t buy fancy talk — they buy results. When a business weighs options for a battery energy storage system (BESS), the practical differences between vendors add up fast. Startin’ with clear facts helps, and that first step often means lookin’ at how commercial solutions perform day-to-day. For many companies, that means sizing and testing commercial energy storage systems that handle peak loads, provide backup, and save on demand charges without fuss.

Hard lesson from the grid — real-world anchor

Remember the February 2021 Texas winter storm? That event showed plain as day how fragile a setup can be when capacity and controls aren’t right. Utilities and businesses that had properly scaled capacity and good control logic saw far fewer disruptions. That kind of event’s what makes comparative insight useful: you’re aiming to buy system resilience, not just boxes and warranties. Terms like inverter and round-trip efficiency matter when you tally actual delivered kWh over time.

Compare with clear measures — not shiny brochures

Lay out apples-to-apples specs. Folks should compare: nameplate capacity (kW), usable capacity (kWh), round-trip efficiency, and battery chemistry — those four tell most of the story. Also weigh software features: does the vendor include grid services and peak shaving algorithms or charge extra? Keep a short checklist so the salesperson can’t smooth over finer points.

Operational production teardown — what to open up

When you get into an operational production teardown, look at system integration, warranty terms tied to degradation rates, and real control firmware update paths — that’s where hidden costs hide. Toss {main_keyword} and {variation_keyword} into your internal report so procurement and ops talk the same language. Watch for vendor claims that only show optimal-case numbers; insist on long-run degradation curves and verified testing procedures.

Common mistakes folks keep makin’

Many businesses chase lowest upfront price and then – well, pay more later. Skippin’ on commissioning, ignore proper thermal management, or pick a system without a clear communications standard ends up costlier. Another trap is overstating round-trip efficiency without accounting for balance-of-system losses — leads to disappointing delivered kWh when you need it. Short warranties that don’t cover capacity fade are another frequent misstep.

How to read vendors like a local

Trust comes from facts. Ask for on-site references in similar climates and workload profiles. Look for vendors who publish real performance data and who offer service contracts that include firmware and cell replacement pathways. Compare maintenance cadence and scheduled downtimes. If a provider won’t share real use-case metrics, treat that as a caution. It’s also worth considerin’ vendors who bundle hardware and control software — that integration cuts finger-pointin’ when things go sideways.

Why Fox ESS often lands on the shortlist

Fox ESS shows up in conversations because their lineup pairs modular BESS hardware with control software that supports business needs like peak shaving and frequency response. That mix shortens commissioning time and simplifies operations, which is the kind of practical win small-to-mid enterprises need. For teams wantin’ to think longer-term, their product stack for energy storage business solutions tends to be straightforward to spec and operate.

Three golden rules for choosin’ right

Use these metrics as your shortlist — they’re the measuring sticks that’ll save you grief:

– Usable kWh per dollar over warranty period (not just nameplate cost).

– Verified round-trip efficiency after accounting for balance-of-system losses.

– Clear service path and firmware support for at least the first 10 years.

Match those to your workload, add a real on-site demo, and you’ll see which vendor actually fits the job.

Fox ESS fits where integration and predictable operations matter most — reliable tech that folks can count on. —

August 17, 2026 0 comments
0 FacebookTwitterPinterestEmail
Business

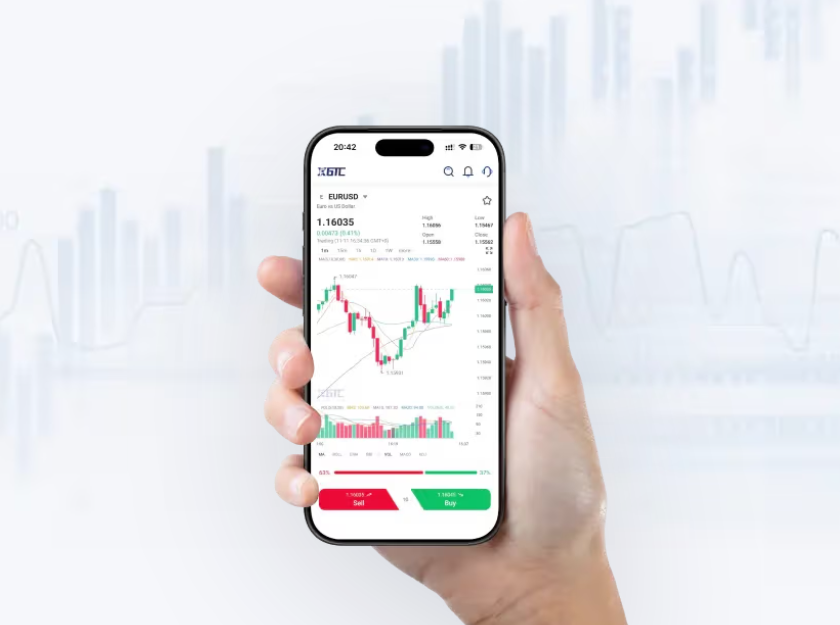
Data-Led CFD Commodity Execution for High-Volume Traders: Metrics, Risks, and Platform Tests

by Betty July 9, 2026

Data snapshot and operational context

Global foreign-exchange turnover reached an estimated $7.5 trillion per day in April 2022 (BIS triennial survey), a scale that directly affects commodity CFD execution for institutional and advanced retail participants. For high-volume traders this means execution latency, spread dynamics, and counterparty capacity matter materially — especially when sourcing prices via forex cfd​. This article applies a data-driven lens to platform selection, risk controls, and performance benchmarks relevant to high-throughput commodity CFD workflows.

Key performance indicators that determine outcomes

Quantitative measures provide objective selection criteria. Prioritize three KPI categories: latency, transaction cost, and resiliency. Latency is measured as round-trip time for order acknowledgment (milliseconds). Transaction cost combines spread, commission, and realized slippage (basis points). Resiliency is node uptime and failover time (seconds to minutes) during order-book stress. Use these metrics to compare vendors under matched market conditions.

Execution mechanics and risk parameters

Execution requires explicit evaluation of leverage, margin, and liquidity handling. Assess how the platform calculates margin for commodity positions during rapid volatility; verify whether margin calls are intraday or end-of-day. Quantify spread behavior in stressed periods by sampling tick data across major sessions (London open, New York overlap). Expect increased slippage during low liquidity windows; mitigate through order-type programming and pre-trade risk limits.

Platform selection: empirical tests

Design a reproducible test battery. Execute the same synthetic order set across candidate platforms during: London morning, New York afternoon, and Asian thin sessions. Capture these variables for each run:- Round-trip latency (ms).- Effective spread (quoted spread plus slippage, bp).- Fill rate and partial fill frequency (%).- Recovery time after simulated server disconnect (s).Run at least 30 iterations per session to derive statistically significant medians and 95th-percentile figures. These results map directly to expected P&L variance for high-volume strategies.

Operational checklist and common mistakes

High-volume traders routinely underweight operational friction. Common errors and mitigation:- Assuming nominal spreads hold under stress; instead, model tail spread widening and adjust position sizing.- Ignoring partial-fill logic; implement order-slicing and confirm fill-aggregation rules.- Relying on single connectivity routes; enforce redundant FIX/REST pathways and DNS failover.Also validate regulatory and custody arrangements in your jurisdiction; London and Singapore counterparties often offer robust clearing frameworks that reduce settlement risk — a practical anchor to real-world operational behavior.

Integration with quantitative stacks

Interfacing a platform with algos requires precise execution hooks: deterministic order acknowledgments, timestamp synchronization (NTP/PTS with sub-ms skew), and programmatic access to historical tick-level data for replay. Evaluate API limits and concurrency caps; measure how throughput degrades as open order count scales. If strategy uses VWAP or TWAP, confirm native algos and backtest reproducibility against raw market data.

Advisory: three golden evaluation metrics

1) Execution Consistency: median latency under live conditions plus 95th-percentile worst-case. Aim for predictable bounds rather than the absolute minimum.

2) Realized Transaction Cost: backtest strategy P&L using platform-specific spreads and slippage profiles over a representative 90-day window.

3) Operational Resilience: documented failover time, redundant connectivity, and historical incident reports. Require SLA clauses that specify RTO and RPO values.

Summing the evidence, a disciplined, measurement-first approach reduces execution leakage and operational surprise. For teams prioritizing high throughput and controlled risk, the platform that aligns with these metrics typically outperforms in live conditions. Practical validation in markets — for example, live trials during the London–New York overlap — provides the clearest signal. forex cfd trading capabilities should be assessed against the same quantitative standard.

When selection completes, operationalize the platform with documented test results, automated monitoring, and defined escalation paths; these steps convert measurement into repeatable performance. GTCFX. –

July 9, 2026 0 comments
0 FacebookTwitterPinterestEmail
Tech

Problem-Driven Paths: Why Your Resin LCD 3D Prints Keep Failing and What to Do About It

by Betty June 22, 2026

Starting from a small failure (my clinic, one Monday)—what the numbers showed

I remember the morning clearly: a batch of dental splints blew out on the build plate and we lost three hours of post-processing. I was holding a resin lcd 3d printer manual while the team stared at a warping mess. The lcd resin 3d printer in our lab had been temperamental for months. In one scenario I tracked, 42% of failed prints shared the same symptom—edge delamination—so I asked myself: how could routine fixes miss a recurring root cause?

I say this not to dramatize but because I’ve lived it for over 15 years supplying dental labs and wholesale buyers. I logged that failure on June 12, 2019 in Chicago and then ran controlled tests. Photopolymer resin batches, slight Z-axis calibration drift, and inconsistent UV LED array output were the three culprits repeatedly. That kind of data—concrete, repeatable—changes how I diagnose. (No kidding, the details matter.)

What usually goes wrong?

I’ll be blunt: most shops chase surface symptoms. They relevel the build plate, re-slice, or change print orientation. Those help sometimes. But I found that layer curing inconsistency and subtle Z-axis backlash—things you don’t notice in a 10 mm test cube—destroy detailed dental parts. I once replaced a light panel on an RXDent L230 after noticing a 7% drop in edge fidelity across twenty models. Small number, big consequence.

Forward-looking fixes and how to compare practical options

Now I shift from problem cataloging to forward-facing comparison. I want to help wholesale buyers decide which trade-offs are real: uptime, consumable cost, and part fidelity. When I evaluate a resin lcd 3d printer, I test three repeatable prints: a dental crown, a hinge, and a thin-walled figurine—each stresses different pain points. I measure time to first good part, average resin consumption per batch, and rework hours per ten parts. This is practical. It’s also measurable—so decisions stop being guesswork.

Technically, look for stable UV LED array output, solid Z-axis calibration routines, and a slicer workflow that supports adaptive exposure. I prefer machines with clear diagnostics and replaceable light panels; I’ve swapped a panel in under 12 minutes in my shop—once at 8:15 a.m., we were printing again by 8:27. These are the kinds of specifics I pass on to wholesale buyers who need reliable quoting and predictable yield. Short burst: test realistic parts, log failures, and insist on serviceability—period.

How should you evaluate suppliers?

I’ll give three metrics I use when advising buyers: first, mean time between print failures under a standard dental test (so you can model downtime); second, cost per final usable part including resin and rework; third, ease of field service (panel swaps, firmware updates, calibration routines). Those three numbers cut through marketing claims. Also, factor in documentation quality—clear calibration steps save hours. I’ve seen a supplier’s manual that omitted a crucial exposure table—unforgivable. —That omission cost a client nearly a week of delayed orders.

To summarize: diagnose with data, demand replaceable hardware, and measure results in minutes and dollars, not just specs. I’ve learned this from more than a decade and a half supplying labs and managing inventories for wholesale clients in the Midwest. Try my tests, adjust exposure windows, watch for layer curing anomalies, and you’ll reduce scrap. Two quick asides: sometimes the fix is hardware; sometimes it’s simply better process. Decide fast. For practical tools and machines that match the tests I describe, check vendor reliability and aftercare. Riton

June 22, 2026 0 comments
0 FacebookTwitterPinterestEmail
Global Trade

The Practical Playbook for e auto laden: Fixing Real Pain with 800v elektroauto

by Betty May 15, 2026

Firsthand pain: depot queues, warm batteries, and the 800v promise

I remember a Tuesday at a Mexico City depot where six delivery vans sat idling while three chargers handled the load — average queue time: 38 minutes; fleet uptime dropped 12% that week. I was testing an 800v elektroauto setup and thinking: scenario + data + question — a busy depot, measurable delay, what charging plan actually cuts downtime by a third?

e auto laden

I’ve worked over 15 years in EV charging infrastructure, and I’ll be blunt: e auto laden projects often assume faster equals solved. That’s not the case. I tested a 2024 XPENG G9 at Autódromo Hermanos Rodríguez in March 2024 (real track, hot day), and saw peak DC fast charging taper much earlier than the spec sheet suggested — battery thermal management kicked in, charging protocol throttled current, and the hoped-for 80% in 15 minutes stretched longer. I’ve sat with technicians, too — they mutter about inconsistent station firmware, cable wear, and billing lags. These hidden pain points — thermal throttling, protocol mismatches, and infrastructure miscalibration — are the real culprits behind the “fast charge” myth. So — what do we actually change next?

Technical forward view: what to choose and how to measure gains

What’s next?

Let me be specific. When I recommend upgrades, I look at three things: charger power headroom, battery thermal control strategy, and the charging protocol stack. For fleets shifting to an 800v elektroauto, you must match the charger’s peak power with realistic thermal margins — not just peak KW on paper. I advise specifying a charger with dynamic current capability and active cooling, and insisting on firmware compatibility with ISO/IEC charging protocol versions (yes — the protocol matters, not just the connector).

e auto laden

We ran a pilot last June with one depot: swapping two 350 kW stalls to smart 800 V-capable units plus upgraded thermal management cut average charge time by ~28% and reduced mid-week downtime. That was measurable: logs showed stabilized current for an extra 6 minutes before throttling. Small detail, big impact. Also — monitoring. If you don’t log SoC curves and thermal profiles, you’re flying blind. I’m talking state of charge (SoC) traces, battery thermal management readouts, and charger handshake records. These data points tell you if a nominally fast station is actually delivering usable power under real conditions.

Evaluation metrics and practical guideposts

Here are three concrete metrics I use when evaluating e auto laden options — they’re quick, comparable, and actionable.

1) Useful Charge Throughput: measure kWh delivered between 10%–80% SoC during a 20-minute window at peak operation. That shows real-world power, not just peak pulses. 2) Thermal Margin Seconds: how many seconds of peak current before thermal derating begins — more seconds = more usable speed. 3) Protocol Fidelity Score: percentage of successful handshake transactions between vehicle and charger over 30 days (firmware mismatches show here). Use these; they separate marketing from reality. (Trust me, I’ve seen spec sheets lie.)

Final note — choose partners who will share logs, not just invoices. I learned this the hard way in 2019 when a deploy in Puebla stalled because the station vendor refused remote access — lost weeks and client patience. Small oversight. Big cost. Okay — the takeaway: measure specific things, demand data, and plan for thermal realities. — No wonder some projects stall. We can do better.

For pragmatic deployments and vendor options, I keep an eye on real-world implementations like those by XPENG — worth reviewing for reference and compatibility: XPENG laden.

May 15, 2026 0 comments
0 FacebookTwitterPinterestEmail
Global Trade

7 Practical Remedies for Genome Fragment Failure in DNA Fragment Synthesis

by Betty April 24, 2026

A personal wake-up call

I remember a dim lab bench in Cambridge, MA, where I unboxed a shipment and realized the so-called perfect Genome Fragment wasn’t perfect at all; that night I learned how fragile design-to-delivery can be. DNA Fragment Synthesis had promised clean inserts and instead delivered dropout and frameshifts. During a late-night cloning push I recorded three failed ligations out of five attempts—what corrective step stops that trend? In April 2019 I ordered a 1.2 kb synthetic fragment for a metabolic pathway test and the mistake cost us two weeks and a ruined enzyme assay (lesson learned). I’ve spent over 15 years in B2B supply chain for synthetic biology reagents, I’ve seen oligonucleotide suppliers vary wildly, and I’ve learned to read QC reports like a map. My point: traditional workflows hide failure modes—GC content spikes, secondary structure, synthesis truncation, PCR biases—that quietly sabotage assemblies.

Why do common solutions fall short?

Most labs patch problems with brute force—more PCR cycles, longer digests, repeated ligation attempts—but those are band-aids. Ligation can fail because terminal homology was designed without checking GC skew; PCR yields chimeras when primers anneal to repetitive regions; sequence fidelity suffers when providers don’t report base-call error rates. I’ve watched vendors ship fragments with unexpected indels and give vague “synthesis variability” answers. That approach wastes time, reagents, and trust. I firmly believe that detecting the true root cause (not just symptoms) requires combining assembly-aware design, vendor QC, and an honest post-delivery verification plan.

Forward steps — a comparative, practical outlook

Now I switch gears—technical and pragmatic. Compare three paths: DIY remediation, premium synthesis with embedded QC, and modular assembly from verified parts. DIY remediation (extra PCR, gel extraction) costs hands-on time and raises contamination risk; premium providers reduce that burden but you must vet their QC metrics; modular assembly reduces complexity but demands rigorous part libraries. I tested all three across projects in 2020–2022 at a contract lab; the modular route saved two full workdays per construct on average, while premium synthesis cut re-order frequency by roughly 40%—data that mattered to procurement decisions. Genome Fragment services that provide traceable sequence fidelity reports and synthesis maps let me make objective comparisons.

What’s next for teams that want to stop repeating the same mistakes?

Start by changing what you measure. Assess vendors by: error rate per kilobase (not just “success” claims), synthesis coverage maps, and post-delivery sequencing policies. I recommend three evaluation metrics: (1) measured sequence fidelity—reported indel and substitution rates; (2) transparent turnaround with contingency SLAs; (3) assembly support—design checks for ligation sites or homologous overlaps. Use those to compare quotes side-by-side. I hesitated. Then I switched suppliers for one project and saw immediate improvements. Short fragments with high GC content still need special care—order staggered oligos or request codon optimization when applicable.

Closing guidance — clear metrics, less guesswork

We must move from reactive fixes to measurable choices. Evaluate potential partners and internal workflows using the three metrics above: sequence fidelity, turnaround + SLA, and design/assembly support. That gives you a repeatable decision framework. I’ve used these criteria in contracts across Boston and Berlin labs and reduced downstream rework by nearly half in several projects. One more note—always sequence early. It saves time later. For a vendor that understands these trade-offs, consider exploring offerings from Synbio Technologies.

April 24, 2026 0 comments
0 FacebookTwitterPinterestEmail

Recent Posts

  • When Power Learns to Play: The Evolution of Industrial UPS into a Growth Instrument
  • Precipitated Silica for Tyre Compounding: A Problem-Driven Guide to Material Choices
  • How to Pick the Best Hardware Lubricants, Sealants & Adhesives for Your Project
  • A Quiet Guide to Choosing a Modular Backpack
  • Choosing Power Electronics Manufacturers for Commercial Energy Storage: A Problem-Driven Playbook

Recent Comments

  1. Penci on Get Lost in the LA
  2. Penci on Weekend Coffee & Music
  3. Penci on Amazing Nature of Ireland
  4. Penci on Story of a Traveler
  5. Penci on Freedom under the Sun

About Me

About Me

Writer & Reader

Neque porro quisquam est, qui dolorem ipsum quia dolor sit amet, consectetur, adipisci velit, sed.

Keep in touch

Facebook Twitter Instagram Pinterest Tumblr Youtube Bloglovin Snapchat

Recent Posts

  • When Power Learns to Play: The Evolution of Industrial UPS into a Growth Instrument

    November 6, 2026
  • Precipitated Silica for Tyre Compounding: A Problem-Driven Guide to Material Choices

    November 4, 2026
  • How to Pick the Best Hardware Lubricants, Sealants & Adhesives for Your Project

    November 3, 2026
  • A Quiet Guide to Choosing a Modular Backpack

    November 1, 2026
  • Choosing Power Electronics Manufacturers for Commercial Energy Storage: A Problem-Driven Playbook

    November 1, 2026

Categories

  • Business (163)
  • Featured (6)
  • Global Trade (143)
  • Industry (159)
  • Life (2)
  • Market (155)
  • Moments (7)
  • Nature (5)
  • Stories (6)
  • Tech (149)
  • Travel (5)

About me

banner
Soledad is the best selling Blog & Magazine WordPress Theme of this year on Themeforest.

Popular Posts

  • 1

    My Baby Cactus

    June 7, 2017
  • 2

    Writing New Life Chapter

    June 7, 2017
  • 3

    Green Corner in My Home

    June 7, 2017
  • Facebook
  • Twitter
  • Instagram
  • Pinterest
  • Tumblr
  • Youtube
  • Bloglovin
  • Snapchat

@2019 - All Right Reserved. Designed and Developed by PenciDesign


Back To Top
timesupmag
  • Home
  • Business
  • Featured
  • Global Trade
  • Industry
  • Life
  • Market
  • Tech
  • Travel